People have
come from all over the world to be here (thanks Fi Gordon for making your way
from Oz).
Keynotes
from Dr Brian Cox, Dr Jock MacKinlay and Maria Konnikova (author of the
confidence game)
The opening slide of the conference maybe one of my favourites ever:


James Eiloart
Tableau is
being used to solve more of the world’s most serious and largest problems. We
are in an era of disruption where start-ups are challenging the large, status
quo players.
2ns half of
the 19th Century – huge amount of disruptors. There were established
players but new innovations were still challenging that status quo. The rules
of the game and competition was very different
Nikola
Tesla – developed ‘Alternating Current’ (and the start of a great band name –
editor’s addition). He was a prolific inventor. In Croatia, he was inspired by
Thomas Edison. They were quite the opposite in terms of characters. Tesla had
OCD. Edison was disorganised and had quite a mean streak. 1884 Tesla travels to
visit Edison. Edison is making a fortune out of selling ‘Direct Current’ so
Edison was pretty protective of his idea. Edison offers Tesla $1m (in modern
value) but when Tesla delivers the work, Edison refuses to pay up. Tesla gives
up and takes a job digging ditches in Manhattan. Tesla gets backed by a bunch
of investors and conceives a lot of remarkable innovations. The light bulb
actually got discovered by Tesla. Edison pays for demonstrations of why Tesla’s
innovations are so dangerous – ie electrocutes an elephant. At the World’s Fair
1893, Tesla demos the latest technologies and shows how safely AC can be by
sending it through his body.
There are 8 million doctors, 21 m teachers and 2m journalists so how can technology unlock the innovation of those professionals.
Matt Francis (Welcome Sanger Trust), Henrik Falldin (Skanska) and Rob Radburn (Leicestershire County Council) are all using Tableau to allow data lead decisions to be made to develop genomics, architecture and empowering social workers (to name but a few). Tableau's job is to build the best analytical canvas to unleash that creativity.

Francois Ajenstat
"Data is the electricity of the 21st Century"
The history of Tabluea
Started at Stanford as 'Polaris' a formal language to describe table based data visualisations. Polaris had three breakthough innovations: 1. VizQL - it allowed an infinate number of visulisations to be created. The VizQL language can be compiled in to a database query. 2.
Francois shows the underlying VizQL and how simple it can be to build charts direclty using VizQL

Francois shows what has been added to Tableau since the last London conference. v9.3 gets the fastest adoption rate. He highlights the popularity of visualisations within Tableau Server.


Tableau 10 has 10,000 customers using the Beta at the moment. Completely new design, font and colours.
1. Any Data
A. New connectors to Google Sheets etc
B. Data Integration at the Row level from multiple sources. Just click on add on the top of the data connection pane in the data preparation window to get to it. Blending now look a lot more like a normal join.

C. Automatic Spreadsheet cleaning to improve the Data Connections
D. Wildcard unioning so you don't have to put everything together (Pattern based Union)
For Everyone
A. Tableau has K-Means clustering automatically built in. No phd required!
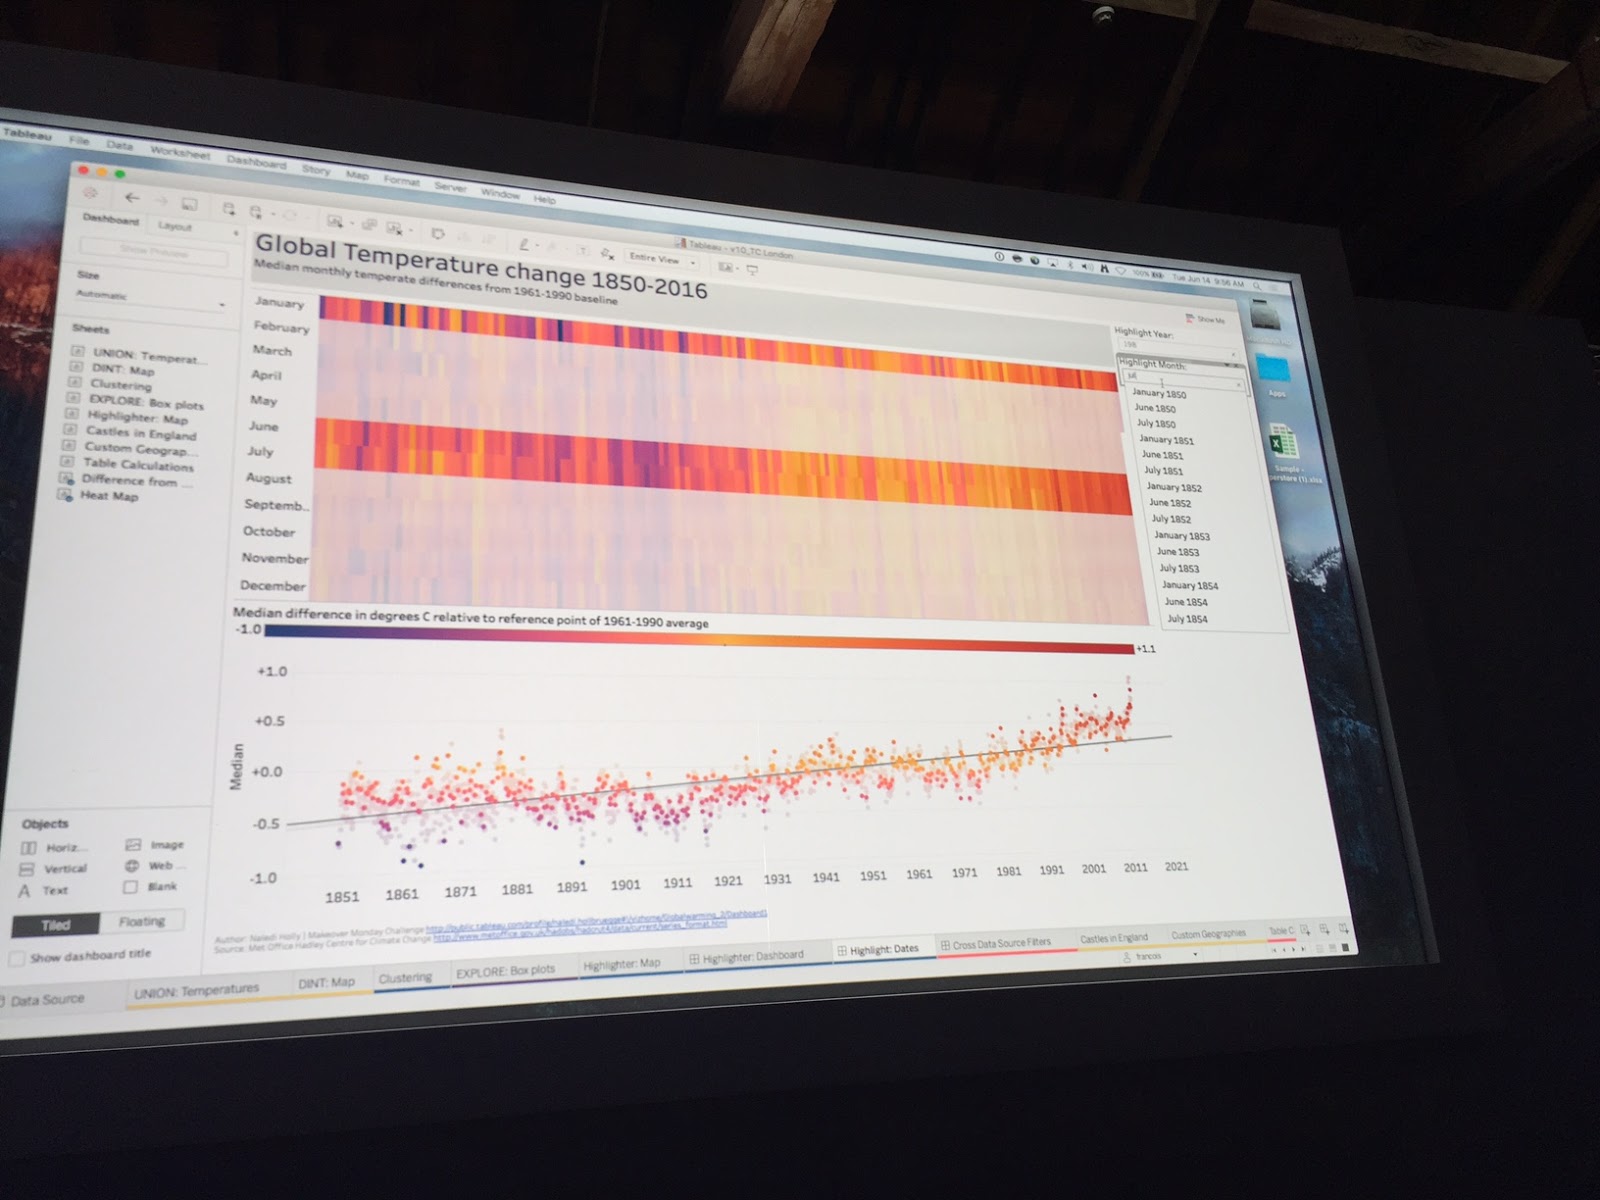
B. Data Highlighter - seeing your data in context. Dynamic search that shows up as highlighting within the product. It's like highlighting dashbaord actions on steriods!
C. Cross data source filters - you no longer need to set up the parameter to pass the where clause within the filter. 'Select all Related DataSources' on the filter.
D. Custom terriorities on the fly by selecting the group and removing the lower level of detail.E. Table Calculation dialogue box -
Anywhere
A. Android app
B. Device Specific Dashbaords - Click 'Preview' to see how the device screen changes what Tableau shows. Click 'Add Layout' for when Tableau doesn't automtically resize the dashboard nicely. All under one URL.

C. Mobile Device Management (MDM) for enterprise
D. Deply server in more places: Back up from Windows and restore on Linux (not in v10) and Google Cloud Platform
E. Web Editing enhancements - Building dashboards within the browser including floating elements and dashboard actions. Formatting at the workbook level. Multiple data sources too.

Enterprise level new features
A. Version control for data sources
B. Subscribe other people
C. Better API management - getData() as an enhancement to the Javascript API. Add D3.js elements in to the webpage including adding in network diagrams
D. Extract data management - extract failure notification
E. Can favourite data sources on the server (and impact analysis coming in later versions just not 10.0)

Go to tableau.com/getbeta to get automatically added to the Beta programme.
This comment has been removed by the author.
ReplyDeleteI like your post very much. It is very much useful for my research. I hope you to share more info about this. Keep posting Tableau online training
ReplyDelete