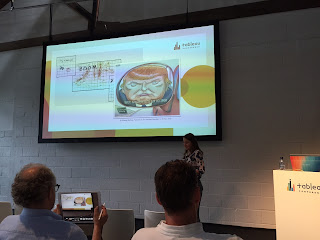
Comic Theory:
1. Sequential Art
2. Visual Grammar / Visual Language
All to apply Comic Theory to Visual Analytics
Comics add single images together to add context to that singular event. This is an obvious link from a single worksheet / chart to good storytelling with dashboards, pages or Storypoints.

McClouds transitions:
A. Moment to Moment transition - very simple progression. The pages shelf allows you to do this in Tableau simply and you can walk through the story step-by-step or moment-to-moment.
B. Subject to Subject - A series of changing subjects within a single scene - Multiple panes within the same view but of the same chart.
C. Aspect to Aspect - different aspects of a place, idea or mood - multiple filters or storypoints to investigate the different angles.
D. Non Sequitur - No logical relationship between the panels - a lot harder to find the story as there is no logic here. Classic for someone's first Tableau data visualisation!
Key takeaways from Transitions: A create logical relationship. B/ Images develop meaning when placed sequentially. C. Can serve as a replacement for written words
Cohn - Visual Language of Comics
Frame Types:
A. Establisher - setup of the story
B. Initial - build up of the story
C. Prolongation - increase tension and increase anticipation
D. Peak - the moment of the story
E, Release - exit - maybe the punchline
Great framework for putting together storypoints in Tableau.
When a comic is in the wrong order, comic storys become very difficult to follow yet we do this with data visualisation often.
The neuroscience of comics - in research, out brain expects a story to flow so when it doesn't the brain kind of gives up and doesn't try harder to understand. Therefore, avoid suprising your audience as the hardest the brain works is at first in setting up the basic understanding of the story in the Establisher phase.
Will be interesting to try the different structures of stories:
Great takeaway: Simplicity creates a Great Impact all on it's own


No comments:
Post a Comment