As a regular Tableau
user I’m guessing you have come across the term jittering*. You may have even
worked out why you want to use it. However, a quick straw-poll in the office
(not statistically accurate) showed that no-one had ever used jittering in
anger. Well that is until now…
*For those that are new users, jittering is the idea that when marks on a two-dimensional scatterplot sit on top of each other, then you can adjust their values slightly so they appear from behind each other. For those who are building 3D scatterplots, please move swiftly on to Stephen Few’s blog to learn why I cringe as I type 3D.
The Problem…
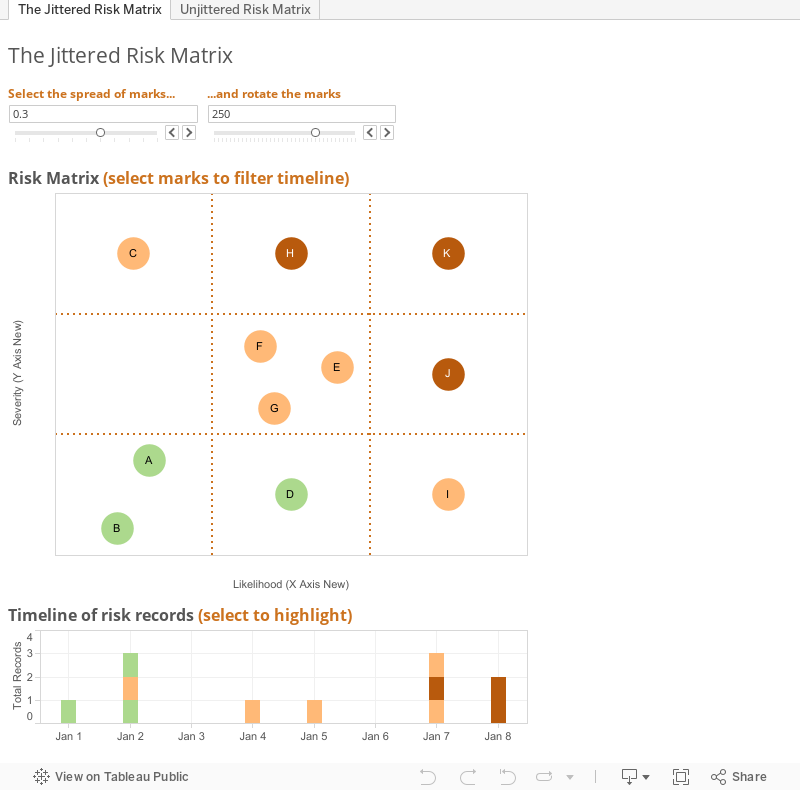
During a Tableau support session, I came across a user who wanted to create a 3x3 risk matrix to include in a report. All risks were rated either low, medium or high on two metrics – likelihood and severity. There was also a lot of data (c. 1,000 rows). The user had resigned themselves to creating hundreds of versions of the matrix to cover all the various points as there is no automated way to complete this.
Well with a lot of help from reading from Alan Eldridge, Mark Jackson and a few other bloggers / community helpers, I came up with the following method. It uses Alan’s method as a base and then I have applied it to this particular challenge so all (any) praise in his direction please.
My thought process went as follows:
1.
Allocate a
numeric risk to the current risk rating
2.
Create
unique risk pairs (ie medium / low, high / medium etc)
3.
Use Alan’s
methodology for jittering around a given point, manipulating the calcs to fit
my data
4.
Design the
risk matrix through reference lines, remove gridlines, tick marks and add
annotations
Hope it's useful for you.
Hope it's useful for you.