Saturday 17 August 2013

Vine videos to help show the way?

Is it time to end the .jpegs, like those used in the post below? Could short videoes, like those produced on Vine, help to show how to do something that words or a static picture just don't get across? What do you find easier? This?
Or?

Friday 16 August 2013

Who rules the (basketball) world?

Custom shapes have been used in many visualisations I have looked at but I hadn't ever tried to import my own images before. That was until now... So how do you do it I hear you ask? Well here's quick view. First, go and find 'My Tableau Repository' in your file structure. Here is the source of unlocking a lot of custom features in tableau (including bespoke colour palettes by using the 'Preferences' file).
Then, you simply create a new folder in the 'Shapes' folder. Call it what you like as this is what will appear in the custom shapes.
When creating your viz, simply click on the 'Shapes' part of the 'Marks Card' and then expand as follows:
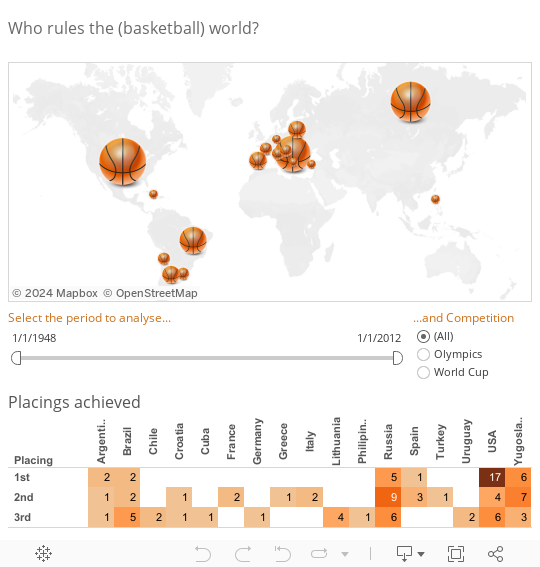
So using the basketballs as a representation of the number of placings each country had shows that the US were not as dominant (especially at the World Championships) as one would expect.
Download the viz from Tableau Public and try custom shapes for yourself.

Thursday 8 August 2013

Free data for all!

Finding good sources are always like looking for a needle in a haystack (if that haystack looked like the freakin Matrix and you didn't have 'Neo' level abilities'. Well here is a link that I want to preserve on the blog because it does a great job at holding those I use (and will appear here in visualisations) and those I am yet to explore. Andy Kirk and co. have hit the nail on the head. Any more favourites?

Do the Spurs always get it right?

The San Antonio Spurs are known across the US Sports arena as the franchise that continually finds hidden gems in the annual draft. This is more remarkable with their continual success as this worsens their picks every year. But who has contributed the most? Are the international picks the secret to the Spurs success? Use the viz below and its Parameter (drop down box) to explore which picks have contributed the most. If you want to know more about how to create a parameter then stay tuned!

Welcome

Here is where I will post my explorations with data through visualisation. I love designing information so it becomes accessible for everyone who is interested so please enjoy and comment about what works and what doesn't.

Here is a starting place - all the number one albums up to earlier this year