Wednesday, 15 June 2016

#Data16 London - A Laguage for Visual Analysis - Jock MacKinlay keynote


In the 1980s Jock started his research in to data visualisation and lots of this is built in to Tableau. 

Visual Analysis uses the power of visual language and visual analysis to combine to be very powerful. 

Jock reading Orwell's 1984 gave him the idea that to protect yourself from Big Brother was to use Data. Playfair's Balance of Trade visualisation gave him the idea to build a programme to allow people to make these kind of charts. 


Bertin's 'Semiologie graphique' (translated in to English from French) became the spine of Jock's phd. The book focuses on the syntax. The main figure allowed Jock to understand what the key aspects to visual analysis were.
Selection: 
A. Association 
B. Selection
C. Order
D. Quantity
Jock joins Association and Selection in to 'Categorical' data The horizontal axis of size, value, texture, colour, orientation and shape allows you to make the association. The language aspect comes from taking visual components and their use is the equivalent of turing words in to sentences.


Bertins actually started out as a Cartographer and hand drew his maps. Understanding the visual system allowed him to make them as clear and impactful as possible. Bertin's built physical tables with rods to allow for sorting (Permiatations Matrices)


At Bell labs, Cleveland and McGill were scientifically researching human performance that validated Bertin's work. Here is there findings:


And Jock's combination of the two:


Jock managed to turn this thinking in to software. Here's a photo of the recording of his 'apt' tool.


Jock got to work at one of the top technology parks (Xerox Park) on the west coast. Dr Stuart Card developed the first mouse as a pointing device.


And some of the first developments the team made:


Human Visual analysis pipeline was created in the late 1990s and forms the basis of normal visual analysis now and how the tools are designed this flow. Tableau uses this flow that there is complex backtracking as the process isn't purely linear as you make analytical decisions:


When Pat Hanrahan transfered to Stanford, Jock got to spend time with Pat and Chris Stolte at Xerox Park. Pat turned Chris to Jock's dissertation. Jock's work was missing the link to databases and that was what really lead to Tableau. 


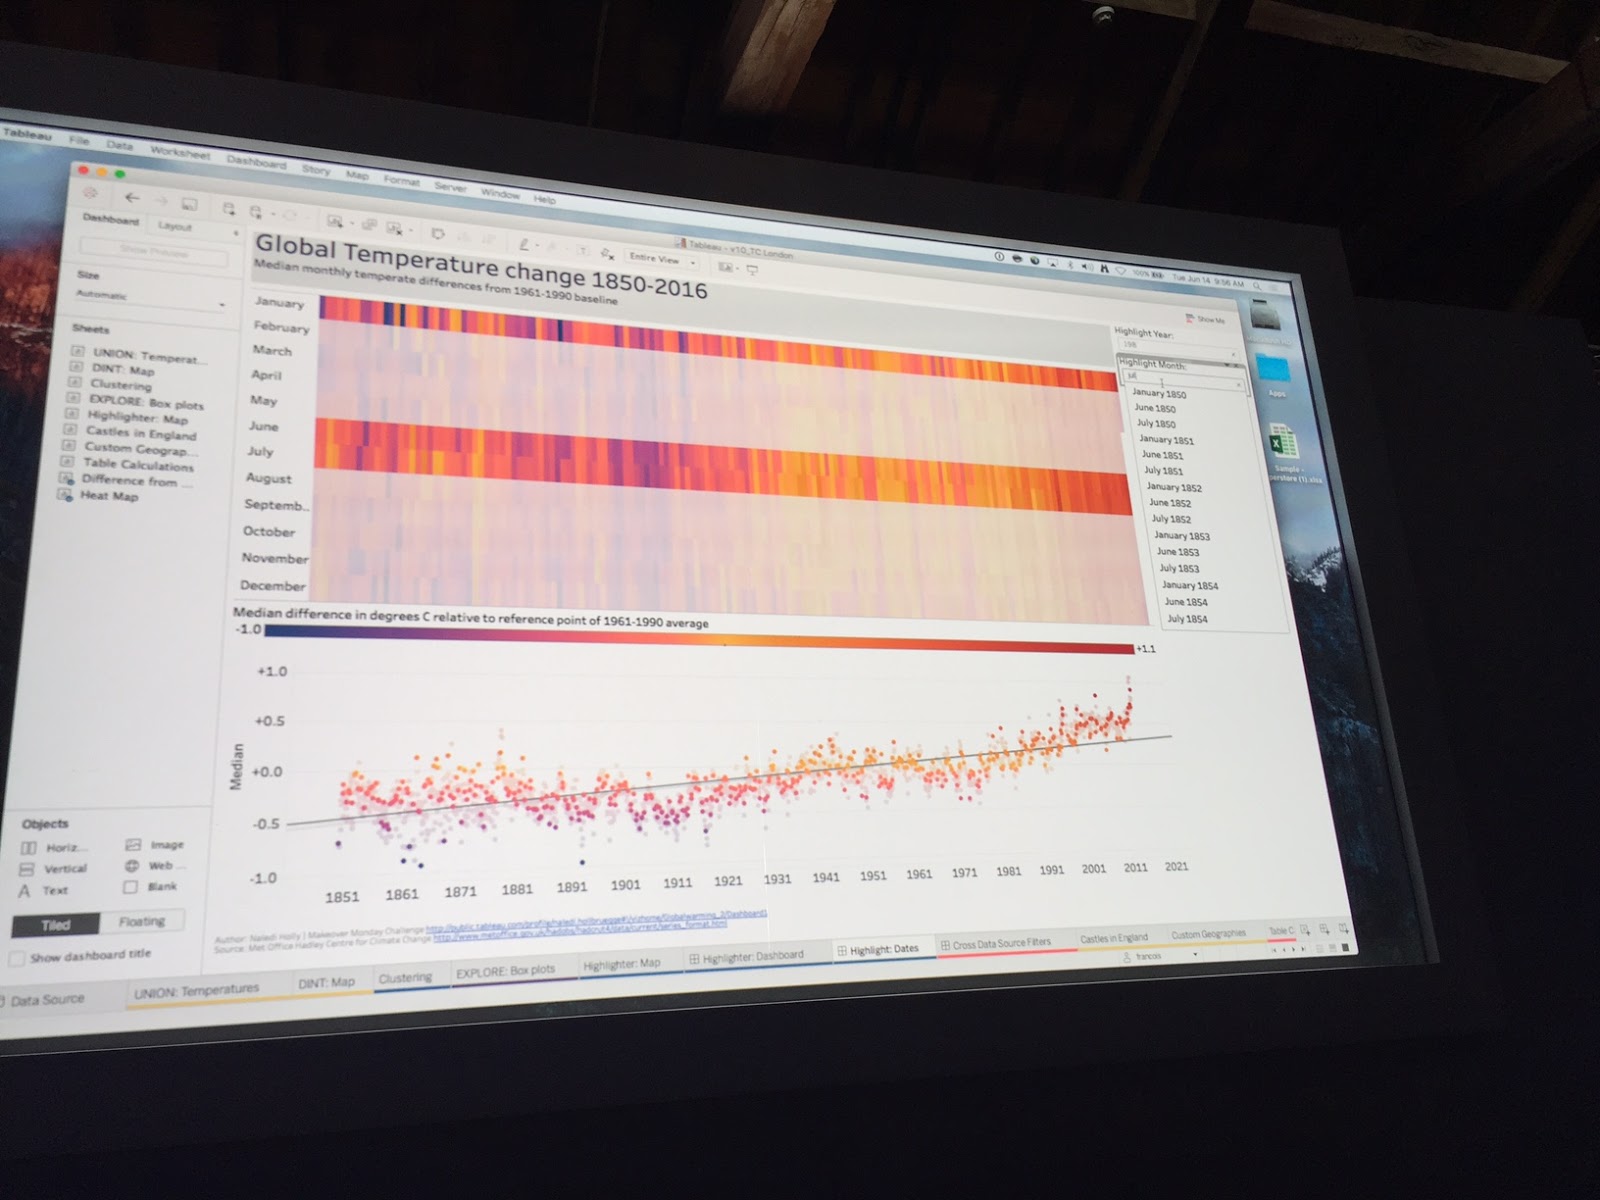
Show Me is Jock phd research in action. Here is the logic behind the scenes:


Jock's demo of wildlife strikes is great. He experienced a birdstrike that damaged the front radar and therefore his favourite dataset to demo became a lot more pertinent. 

The present - Research. Tableau has a strong research team to do fundamental research as it is really trying to understand a lot of visual language aspects. Here is some of the research that is currently happening. 

Humans and computers are different in their skills. Language makes Humans cooperative. Humans are intuitive, computers are not but they are great at diving deeply in to the data. A few researchers have dived more deeply in to this. The 30-40 categorical data fields can be analysed a lot faster than humans so could Show Me be developed to find the signal within the data? 


In organisations, we need to cooperate. This can be tough to do so can computers show who has what data more effectively? 

...more to come

Tuesday, 14 June 2016

#Data 16 - Brian Cox keynote

How data helps us study some of the biggest questions of our age?


The Theory of General Relativity shows how thinking about fundamental questions can lead to massive examples. Einstein challenged the way we think about gravity and the forces in the universe.


Freefall is a state of rest and a rewrite of Newton's laws. We see this in the International Space Station where everything stays still when released. It's why sitting is hard work because we are under force from gravity.

Einstein replaced force with geometry. Newton's law of attraction was replaced with Geometry (Space Time) - Einstein's Theory of General Relativity. Using Einstein's theory about gravity, you get the idea that the Universe is moving and therefore there was "a day without a yesterday" (Lemaitre). Using the equations therefore predicted what was in the universe before it was discovered and proven.


Huble taking pictures of Andromida in 1923 and understanding behaviours of types of stars proved there were other galaxies to our own. Huble went on to use 'Red Shift' to show the expansion of the universe in 1929.


This data is essentially wrong so he was wrong. The data was represented properly but his data was actually wrong (disproven with modern data)! Basically, Huble was measuring the galaxies were too close.

There are 350 billion galaxies in the observable galaxy. There seems to be patterns and therefore, what lead to that sort of pattern is one of the big unsolved problems. If you held a 5p coin to the sky, 75 feet away you would still get 10,000 galaxies in that tiny piece of sky. That means there is a lot of data to analyse.

Gravitational measurement of the stretching and the squashing of space /time. One detector is in Louisiana and one in Washington State. There was a detection made of distruption because of two large black holes merging. The actual event happened over 0.05 seconds. It went from 1/3rd to 2/3rds the speed of light in a 1/10th of a second. It left an object the mass of 60 times the mass of the sun. This is the triumph of Einstein's Theory. It's the first time that light wasn't used and gravitational waves that were.

The idea of the moon before we started exploring our Solar System was of a barren moon (due to our own). This is far from the case. The rings of Saturn are just 2 meters thick but 100km wide. One small moon of Saturn hass water and is very active. These water vents (pictured) is very much like our own start of life on Earth.


The Large Hadron Collider is producing huge amounts of data and is mimicing the initial collisons that were present at origin of the universe. Dr Brian Cox works on the Atlas detector. It captures Proton / Proton collisions and this actually captures a Higgs particle (Muons are the red lines)


And extra findings like (not statistically proven yet) but there are particles that are not currently recognised that could be dark matter or signs that additional dimensions actually exist. My mind is offically blown right now so apologies for the words after this part...


The 90 billion light years across can be measured back to 10 x-22 of a meter across. This distribution helps to predict with precision about the distribution of particles. The eternal inflation model shows that there could be multiple big bangs as part of a longer cycle so there could be an infinite number of universes. Welcome to the Fractal Multiverse!!

Everyone loves Maps - Andy Kemp


1. Why use maps?
A. I have geograhpic information
2. It's nice to see on the map
C. People ask for it
D. People question maps less*    *100% true according to Andy
Maps add context to the information presented.

When should you use a map? Basically when you start the question 'WHERE'?

2. Mapping Basics

Your data + Geocoding + Background Map gives you mapping in Tableau. 

You can tell Tableau to give a geographic role and if you aren’t using any geographic data, Tableau doesn’t do any geocoding to remove the performance overhead.

Cities with populations of 15,000 people or more have a stored longitude and latitude in the Tableau geocoding database.

Tableau now supports the same hotkey shortcuts as Google Maps and the other major mapping tools.

Pairing up dashboard actions with maps can be insanely powerful. I always forget how much context this adds to the dashboard. 

New definitions for unknown options: 1. Show at default positions - umm place a mark in the middle of the map. 2. Filter data - ahh, just get rid of them! Lovely descripitions. 

3. Next Level Techniques
A. You can add your own geocoding for data specific to your own organisation
B. Background images - floor plans, campus buildings, transportation maps etc


C. Mapbox - you can create your own background mapping (and horrendousness too!)
D. Don't forget about the power of WMS mapping. The Netherlands has a lot of the best free WMS services available worldwide.


Nice explanation of Polygon mapping too (to build Choropleth maps)


4. What's New?
A. 9.3 Support for polygon boundaries for postal code for 42 European countries. Restrict end user support
B. Coming soon - being able to put shape files straight in to Tableau
C. In 10 - being able to roll up from 5 digit postcodes to 4 digit postcodes to 3 digit etc

Openning Tableau Keynote - James Eiloart and Francois Ajenstat

People have come from all over the world to be here (thanks Fi Gordon for making your way from Oz).

Keynotes from Dr Brian Cox, Dr Jock MacKinlay and Maria Konnikova (author of the confidence game)

The opening slide of the conference maybe one of my favourites ever:


James Eiloart

Tableau is being used to solve more of the world’s most serious and largest problems. We are in an era of disruption where start-ups are challenging the large, status quo players.

2ns half of the 19th Century – huge amount of disruptors. There were established players but new innovations were still challenging that status quo. The rules of the game and competition was very different


Nikola Tesla – developed ‘Alternating Current’ (and the start of a great band name – editor’s addition). He was a prolific inventor. In Croatia, he was inspired by Thomas Edison. They were quite the opposite in terms of characters. Tesla had OCD. Edison was disorganised and had quite a mean streak. 1884 Tesla travels to visit Edison. Edison is making a fortune out of selling ‘Direct Current’ so Edison was pretty protective of his idea. Edison offers Tesla $1m (in modern value) but when Tesla delivers the work, Edison refuses to pay up. Tesla gives up and takes a job digging ditches in Manhattan. Tesla gets backed by a bunch of investors and conceives a lot of remarkable innovations. The light bulb actually got discovered by Tesla. Edison pays for demonstrations of why Tesla’s innovations are so dangerous – ie electrocutes an elephant. At the World’s Fair 1893, Tesla demos the latest technologies and shows how safely AC can be by sending it through his body. 

There are 8 million doctors, 21 m teachers and 2m journalists so how can technology unlock the innovation of those professionals. 

Matt Francis (Welcome Sanger Trust), Henrik Falldin (Skanska) and Rob Radburn (Leicestershire County Council) are all using Tableau to allow data lead decisions to be made to develop genomics, architecture and empowering social workers (to name but a few). Tableau's job is to build the best analytical canvas to unleash that creativity. 


Francois Ajenstat
"Data is the electricity of the 21st Century"

The history of Tabluea
Started at Stanford as 'Polaris' a formal language to describe table based data visualisations. Polaris had three breakthough innovations: 1. VizQL - it allowed an infinate number of visulisations to be created. The VizQL language can be compiled in to a database query. 2. 

Francois shows the underlying VizQL and how simple it can be to build charts direclty using VizQL


Francois shows what has been added to Tableau since the last London conference. v9.3 gets the fastest adoption rate. He highlights the popularity of visualisations within Tableau Server.


Tableau 10 has 10,000 customers using the Beta at the moment. Completely new design, font and colours.


1. Any Data
A. New connectors to Google Sheets etc
B. Data Integration at the Row level from multiple sources. Just click on add on the top of the data connection pane in the data preparation window to get to it. Blending now look a lot more like a normal join.


C. Automatic Spreadsheet cleaning to improve the Data Connections
D. Wildcard unioning so you don't have to put everything together (Pattern based Union)

For Everyone
A. Tableau has K-Means clustering automatically built in. No phd required!
B. Data Highlighter - seeing your data in context. Dynamic search that shows up as highlighting within the product. It's like highlighting dashbaord actions on steriods!


C. Cross data source filters - you no longer need to set up the parameter to pass the where clause within the filter. 'Select all Related DataSources' on the filter.
D. Custom terriorities on the fly by selecting the group and removing the lower level of detail.E. Table Calculation dialogue box - 

Anywhere
A. Android app
B. Device Specific Dashbaords - Click 'Preview' to see how the device screen changes what Tableau shows. Click 'Add Layout' for when Tableau doesn't automtically resize the dashboard nicely. All under one URL.


C. Mobile Device Management (MDM) for enterprise
D. Deply server in more places: Back up from Windows and restore on Linux (not in v10) and Google Cloud Platform
E. Web Editing enhancements - Building dashboards within the browser including floating elements and dashboard actions. Formatting at the workbook level. Multiple data sources too.


Enterprise level new features
A. Version control for data sources
B. Subscribe other people
C. Better API management - getData() as an enhancement to the Javascript API. Add D3.js elements in to the webpage including adding in network diagrams
D. Extract data management - extract failure notification
E. Can favourite data sources on the server (and impact analysis coming in later versions just not 10.0)


Go to tableau.com/getbeta to get automatically added to the Beta programme. 

Sunday, 12 June 2016

Why invest in yourself at the Conference?

Self-reflection is a great thing. Looking at yourself in the mirror and understanding what gaps you have in your skillset despite being considered good at what you do is really healthy. For all those Tableau Jedis and Ninjas, now is the time to do that… it’s conference season! Work out what those knowledge gaps are and hit the conference sessions that will fill those gaps (or canyons in some cases). 

Whenever I mention that I’m off to the Tableau conference, I normally get one response – “enjoy the party” and they are right, the partying is great. But attending the conference has some career benefits too.

1. Knowing what is coming soon
No Tableau Ninja worth their salt won’t have an eye to the future. Keeping your eye on what is getting voted up on the Ideas forum but seeing what is coming soon during the ‘Devs on Stage’ session at the conference is something else. Often, the features won’t be in the live version for some time but being able to explain what is coming can help your Clients or Colleagues plan for the future – do you need to invest in a different mobile reporting tool or will the app upgrade hit the spot. Is it time to polish up those Table Calculation skills or has Tableau just made life easier by redesigning their implementation.


2. Learning
Before I joined The Information Lab, the main learning opportunities I had was to attend the conferences to seek out new techniques, hints and tips. And those learning opportunities are everywhere. The Zen Masters’ sessions will show skills that are often a stretch for all but the other Zens but knowing what is possible will help you when you get that project that you’re not sure whether can be done in Tableau or not. The Product Consultants are also a great source of knowledge. They are likely to have spent the most time with some of the newer features so the Product Consultant sessions are great ones to attend. I think everyone still lives by Bethany Lyons Level of Detail sessions last year. The best thing is, what is learnt is often shared in snippets on Social Media.


3. What other companies are doing with Tableau
If you are a consultant, you get to see a lot of different organisations introduce and grow Tableau. This knowledge is valuable in understanding what to and what not to do. If you’re not a consultant or haven’t got the budget to stretch to getting some of our time, then hearing from customers’ experience is the next best thing. In my first Tableau conference (London 2013), I was lucky enough to get to present Barclays’ Tableau journey with Peter Gilks. Whilst it was fun reflecting on the work we had done, it was great to get feedback from the audience on what else we could look to do that they had found to be successful. I still get people come up to me and thank me and Peter for inspiring them to get behind their Tableau deployment (or give it a go) and love how much the hints and tips helped them to develop faster.


4. New Cities – new experiences – new friends
Getting to travel to the conferences gets you to see more of the world. Here’s Peter and I in New York before we headed Washington DC for the Global conference in 2014.


Little did either of us know that the global conference was going to be the chance to cement all the friendships we had started to form on social media. Data Geeks are often insular by nature but there is something about going and spending time with those who share the data visualisation passion that makes chatting to others easy. As you can see, we are a shy and retiring bunch.


So, what more could you want? Learning opportunities everywhere you turn, knowing what is coming next in your favourite data tool and the chance to meet some fabulous people. See you in London, Munich and Austin folks – come and say hello.

Sunday, 22 May 2016

Makeover Monday...well kinda

Every week Andy Kriebel and Andy Cotgreave have been running an initiative to get more people visualising data and thinking about the pros and cons of different visualisation types. I really enjoying seeing what comes through the twitter feed in terms of imagery and discussion about the visualisation.

This week, like a true Sunday in May, it's raining outside so instead of being on the bike, it's time I got stuck in. In my title I describe this as "kinda" Makeover Monday as yes I have written it on Sunday but more importantly it's not a makeover.

The visualisation I have created appeases my own interests instead. When I was 'making over' the original visualisation by taking multiple looks at the data through different charts type (always do this) to see what was coming through the data about the original subject (the increasing imports of middle eastern countries) I found the Soviet Union / Russia position much more interesting.

Despite ending up in a technical job, I am actually a History and Politics graduate and my dissertation was on the Russian Intelligentsia after the fall of Communist Russia. Therefore, when the I saw the dominance of the US and USSR spending throughout the height of the Cold War, I was hardly surprised. When the USSR did disappear, I was expecting Russia to record a huge amount of either Imports or Exports. But no, it took Russia until 2006 to make an appearance after 1993. The provision of Arms by the US doesn't surprise me but the fact that Russia has such a high surplus does.


I built this visualisation in v10 beta of Tableau to aid the beta testing so am not able to upload it to Tableau Public but will at some point. I'm still looking forward to seeing what other people come up with but am intrigued as to what other stories are in the data.

Tuesday, 10 May 2016

Creating an easy user experience when using multiple data sources

The challenge: can you let the user pick the last 'N' amount of values? Easy!  

The problem: you have two data sources, those data sources are at different levels of granularity (one months, the other days), they cover different date ranges. Suddenly, not so easy! 

Here's how I worked around it (and a sneaky look at Tableau version 10)