I know it’s a little late as Tableau’s tips month was March but it was a crazy month for me. I haven’t even caught up on all the tips that were posted (apologies if someone beat me to these).
Tableau has a very clean User Interface and to achieve this, hundreds of hours of work has gone in to only letting users see the options that are relevant at the right time. However, I often see that Tableau is sometimes too good at only showing the right things. It’s easy for Users to miss what is staring them in face so here are a few of my favourites. I’d love to hear yours!
Tableau has a very clean User Interface and to achieve this, hundreds of hours of work has gone in to only letting users see the options that are relevant at the right time. However, I often see that Tableau is sometimes too good at only showing the right things. It’s easy for Users to miss what is staring them in face so here are a few of my favourites. I’d love to hear yours!
1. Replacing the axis in the view
Ever wondered what that black square is when you hover over a green data field over an existing axis? When you release your mouse button, you will replace the existing axis with your previously hovered data field if you release it over the square. If you don’t release the field on the square, then you will trigger Measure Name / Measure Values as you are placing two data fields in to one space.
2. Percent of Total in the Analysis menu
I was teaching when I found this one. Someone in my class piped up saying they could create a table calculation in the analysis menu – I love learning from others. The best thing about this technique is that the table calculation persists even if you change the measure you are analysing – brilliant!
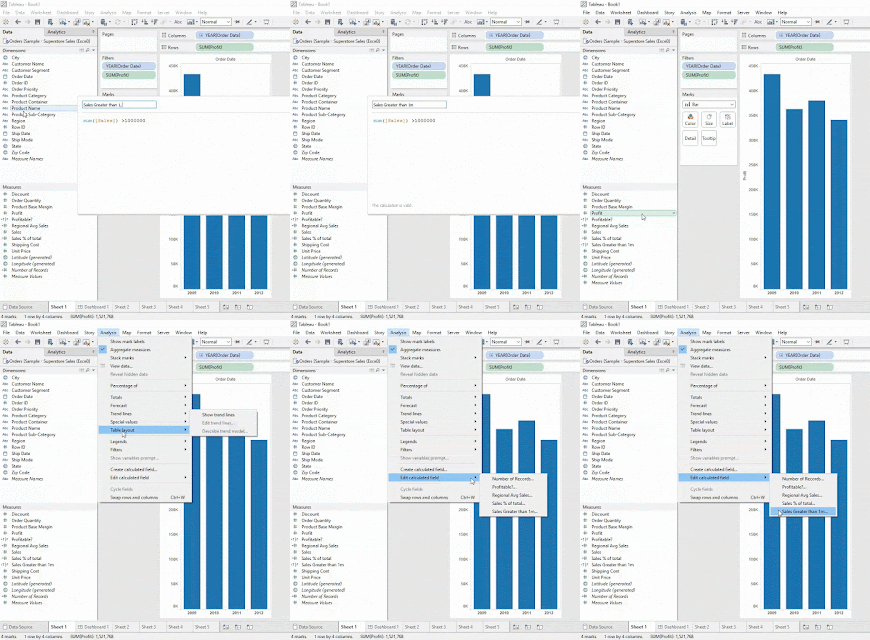
3. Edit Calculated Field in the Analysis Menu
Ever create the greatest calculation known to human kind. Click ‘ok’ in the calculated field window and then can’t find you calculation you just created as you can’t remember what you called it. Don’t worry me too! Go to the Analysis menu and ‘Edit Calculated Fields’ and there is a list of all your calculations that you have created (and Number of Records). You calculation will be lurking in this much smaller list.
4. Include in Tooltip – right click on data field
Another recent find that I have seen before but never thought to use. Great if you don’t want something in your Tooltip but don’t want to edit the whole tooltip. Right-click the data field you want to remove from the tooltip and untick ‘Include in tooltip’.
5. Button underneath the Window Option – to show filters quickly
No great list on the internet included just four entities. Therefore, I went in search of other areas I had never seen / thought about in Tableau. Hello there little icon under the Windows menu option! When hovering your mouse over, you get the pop-up description of ‘Show / Hide Cards’. Great if you want to show the colour legend after highlighting the card quickly. However, I think the greater use here is to click on it, go down to filter and then you can show and create a filter on any data field that is used in your view.
Hope at least one of those are new to you and you find them useful. Please let me know you hidden in plain sight tips and I will create a series of blogs if we get enough!


thanks for sharing such a nice info.I hope you will share more information like this. please keep on sharing!
ReplyDeletetableau training in Chennai |
tableau course in Chennai
This comment has been removed by the author.
ReplyDeleteThank you so much for providing information about Tableau and other similar aspects.Tableau provides for the easiest breakdown of complex IT problems.
ReplyDeleteTableau Rest Api Connection